Water, made visible for your community
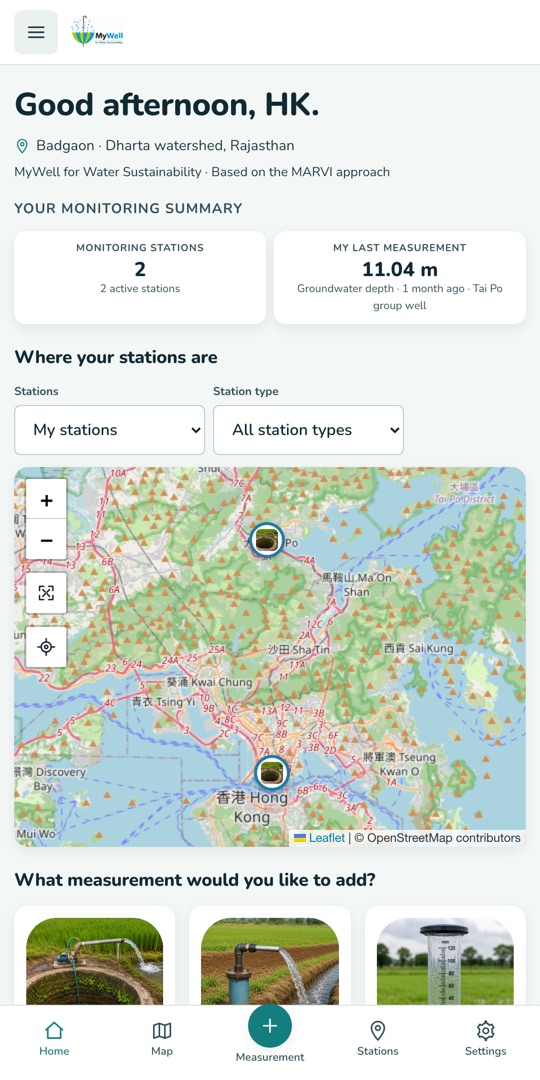
MyWell is a free, community-focused water monitoring and learning app, built on the MARVI approach to participatory groundwater management. Record readings from wells, rain gauges and other local water sources — then see them on a map and watch the trends.
MyWell is free on Google Play and the App Store. Prefer not to install? The web app has every feature too.
One place for your local water story
While its foundation is groundwater, MyWell supports broader local water monitoring — rainfall, surface water, water quality and water storage systems.
Stations for every source
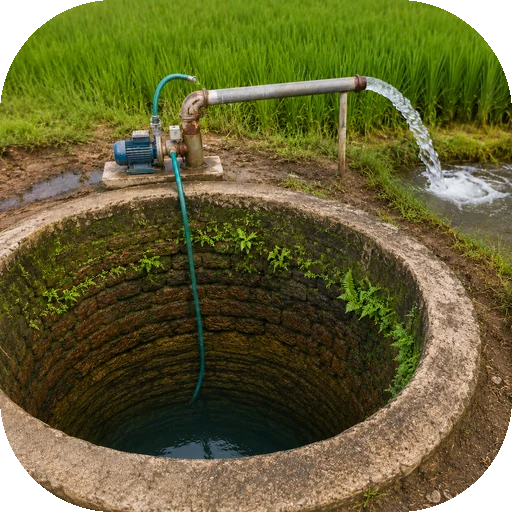
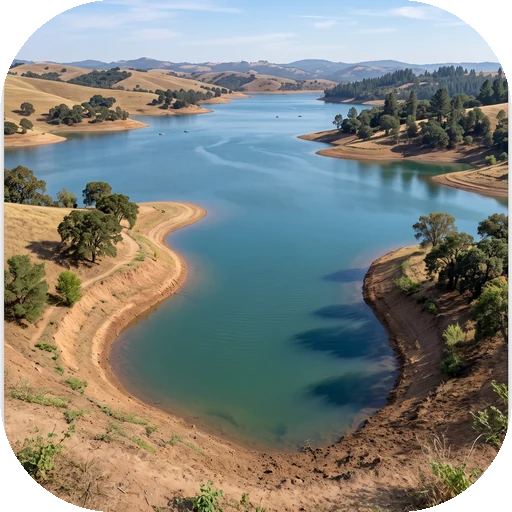
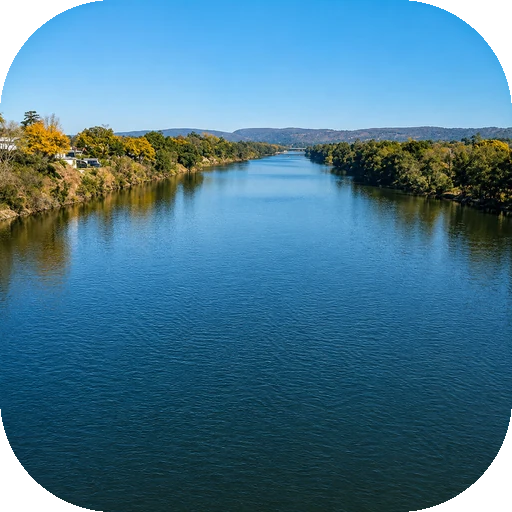
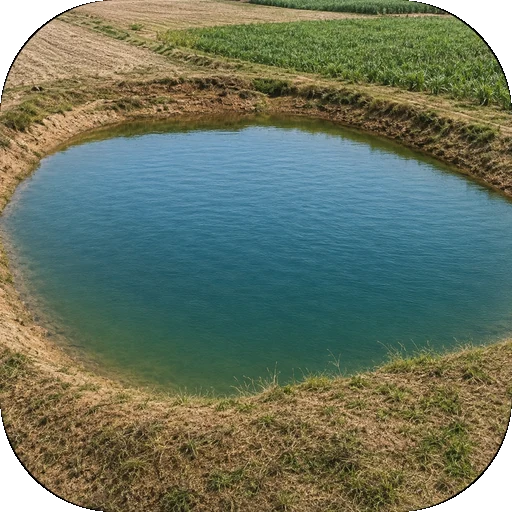
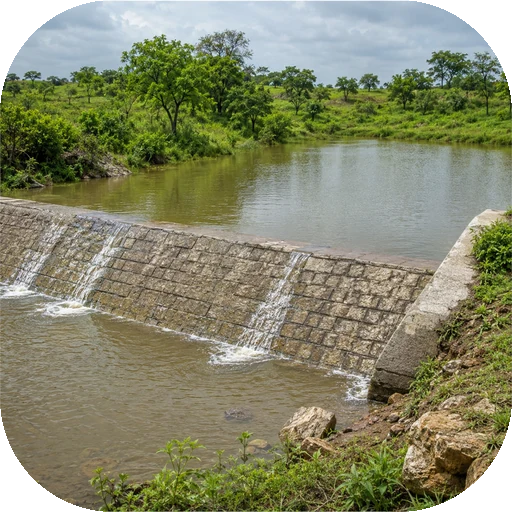
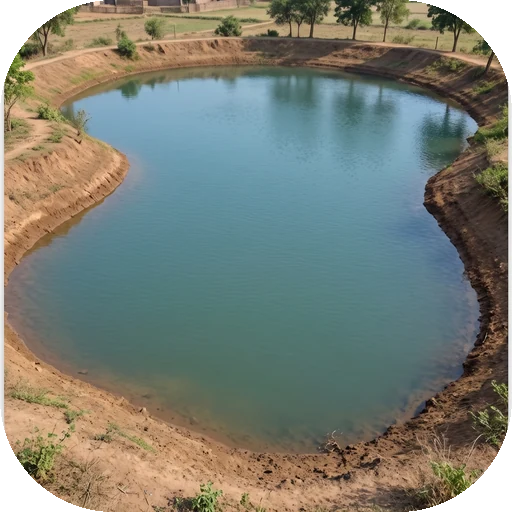
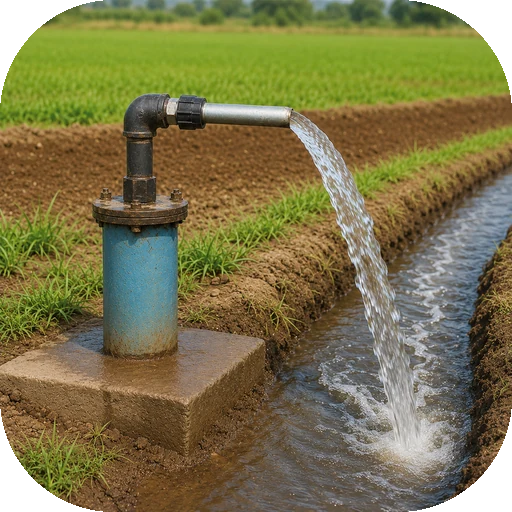
Wells, boreholes, rain gauges, check dams, rivers, springs, reservoirs, rainwater tanks and more — with photographs, notes and locations.
Interactive map
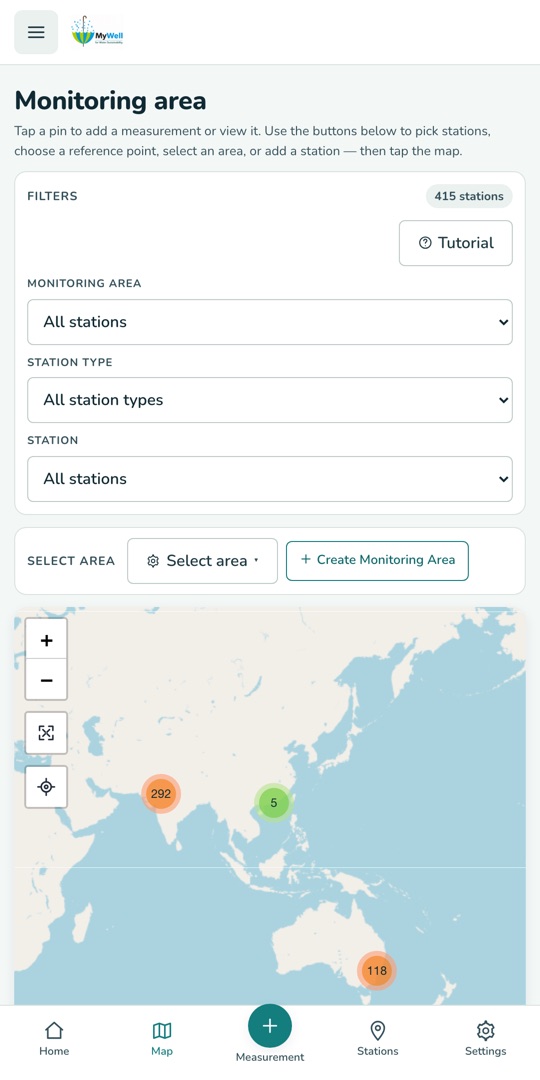
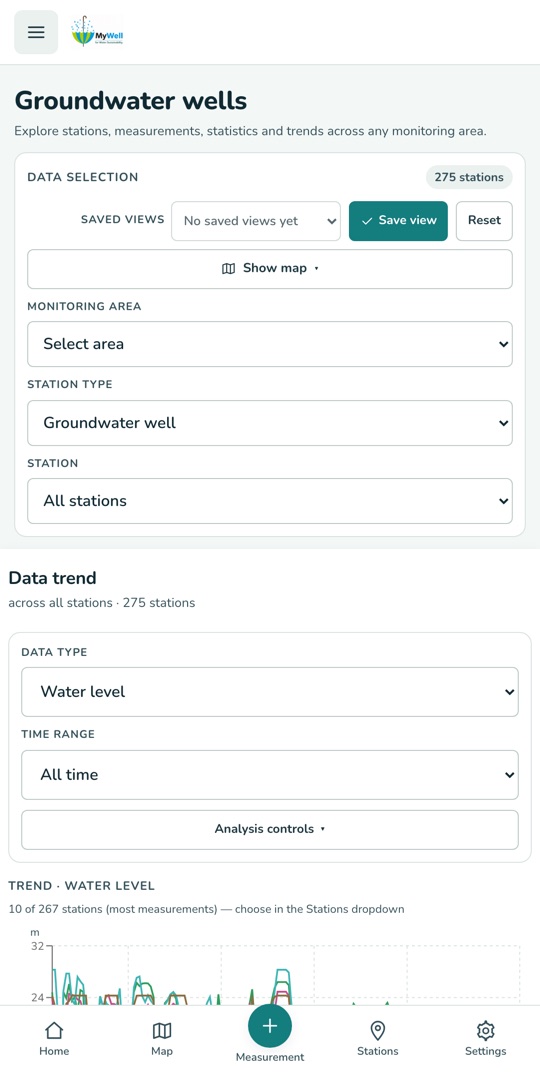
Every station on one map. Draw a monitoring area to focus on the wells, gauges and dams that matter to you.
Trends and comparisons
Compare current and historical measurements with simple charts, summaries and seasonal patterns.
See it in action
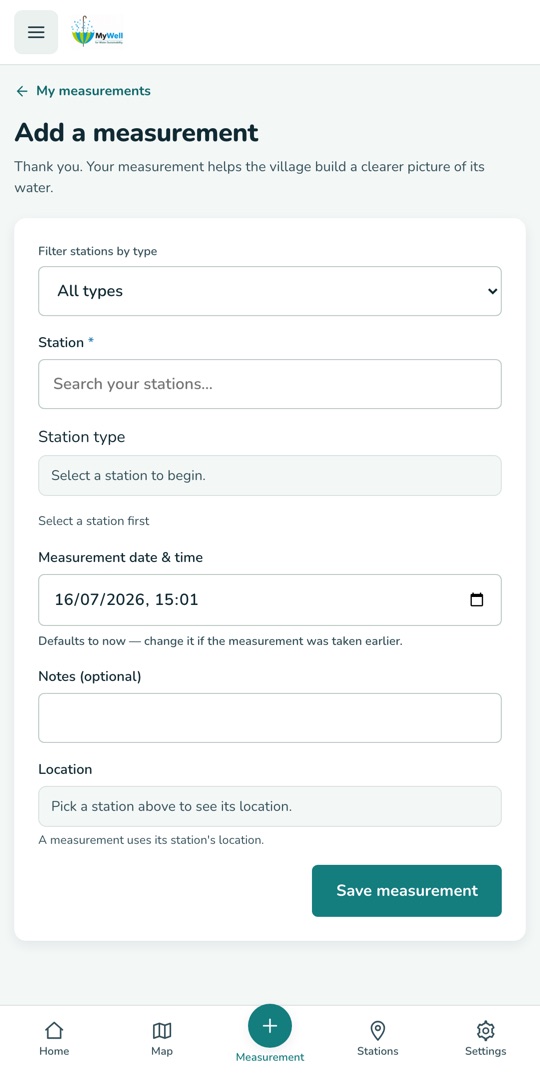
The same app, from the field to the big picture — pick your stations on the map, record a visit, and watch the trend build.
Who is it for?
MyWell is designed for farmers, community volunteers, schools, universities, researchers, non-government organisations and government agencies. It supports practical learning, citizen science and informed discussion about groundwater, rainfall, surface water and other local water resources.
Everything you need to monitor local water
From a single village well to a national dataset — the same simple tools.
Stations for every source
Wells, boreholes, rain gauges, check dams, rivers, springs, reservoirs, rainwater tanks and more — with photographs, notes and locations.
Field-ready recording
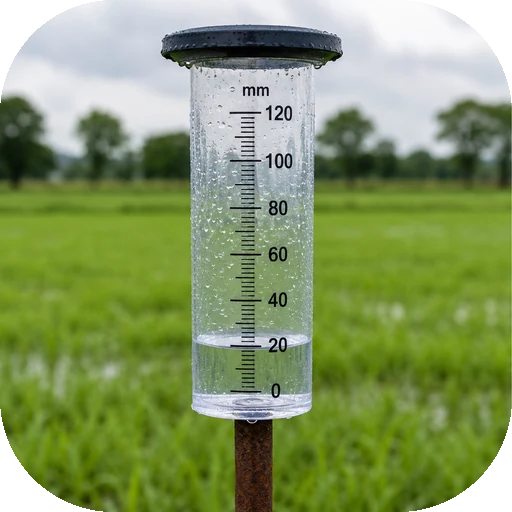
Log groundwater levels, rainfall, water quality, surface water and storage readings in seconds, right at the station.
Interactive map
Every station on one map. Draw a monitoring area to focus on the wells, gauges and dams that matter to you.
Trends and comparisons
Compare current and historical measurements with simple charts, summaries and seasonal patterns.
Water-quality safe bands
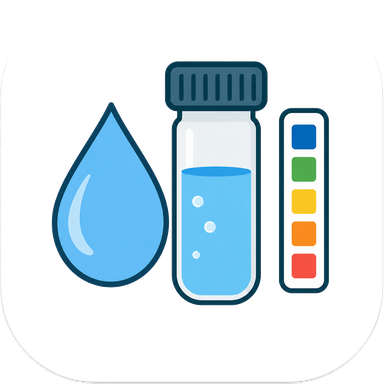
Quality readings are charted against safe-range guidance, so out-of-range values stand out immediately.
QR codes on stations
Print a QR code for a station; scanning it opens that station directly in the app — perfect for shared field sites.
Teams and organisations
Work as a group: organisations manage their own members, stations and data, with clear roles for contributors and viewers.
Bulk data upload
Bring existing records with you — template-based file uploads move whole station histories into MyWell.
60+ languages
The whole app — menus, forms, guided tours — is available in more than sixty languages.
How it works
Four steps from "we should watch that well" to a living record your whole community can read.
Create a free account
Sign up with your name and email. New members can record data straight away, and a built-in tour shows you around.
Add your stations
Register the wells, rain gauges, dams or springs you monitor — name, location, type, photo. Each gets its own page and code.
Record readings
On each visit, log the water level, rainfall or quality readings — with photos and notes if you like.
Watch the trends
Charts and summaries build up automatically. Compare seasons, spot declines early, and share the picture with your community.
Watch how it's done
Eleven short tutorials, narrated, recorded from the real app. Start with the first one and you will have an account in about three minutes.
Create your account3:25
Start here. We fill the sign-up form in together — your name, country, choosing a username, and a password that will hold — then sign in with it.
Your Home screen2:12
What you see every time you open MyWell: your stations at a glance, your own map, the record-a-reading shortcut and your recent activity.
Easy vs Advanced view1:44
Choose what you see: a streamlined menu for daily field monitoring, or the full suite with community analytics, trends, and admin tools.
Add and manage your stations1:26
Register the wells, rain gauges, dams and springs you look after, and keep the list tidy as it grows.
Record a reading2:26
A complete visit from start to save — choosing the station, entering water level or quality, adding a photo, and saving it.
Find stations on the map1:48
Both maps explained: your own station map and the all-stations map, with the area and station-type filters.
Map tools & monitoring areas2:15
Search by place or GPS coordinates, use floating filter widgets for station type and radius, and build custom monitoring areas.
Areas, trends and statistics2:17
Read the shared dataset: pick a monitoring area, then read its water-level trend chart and its summary statistics.
Build your own chart2:56
The chart builder — add data series, pick stations and data types, set the time range, and save a view to come back to.
Weather and rainfall1:16
Rain is where groundwater comes from. The Weather page puts the forecast beside the wells it will feed.
Settings and your language1:27
Make MyWell yours: switch between sixty-one languages, change the display and theme, and replay any part of the built-in tutorial.
A shared, public water dataset
Every MyWell reading joins a shared dataset that anyone with an account can explore — usable for non-commercial education, research and community water management. Community records sit alongside major public datasets.
🇦🇺Australia — groundwater
Bureau of Meteorology bores from the Global Groundwater Monitoring Network — about 25,000 wells with decades of water-level history.
🇮🇳India — groundwater
Central Ground Water Board stations via the Global Groundwater Monitoring Network — about 40,000 wells with quarterly readings.
🇦🇺Australia — rivers
WaterNSW surface-water gauges, with millions of river-level readings across New South Wales.
🌏Your community
Readings from farmers, volunteers, schools and researchers — the MARVI citizen-science record that started it all, growing every day.
Personal details stay private: who recorded a reading is visible only inside their own organisation. See the privacy policy for the fine print.
Frequently asked questions
Short answers to the questions we hear most.
How much does MyWell cost?
Nothing. MyWell is a free, community-focused app developed through the MARVI project for education, citizen science and community water management.
Can I use it on both my phone and a computer?
Yes — the same account works in the web app and the mobile app, and your stations and readings stay in sync.
Who can see the data I record?
Readings join a shared water-monitoring dataset that signed-in users can explore, but your personal details are visible only within your own organisation. Location of stations is part of the shared record; who recorded a reading is not public.
Do I need to be an expert?
No. MyWell was built with farmers, students and community volunteers — a guided tour walks you through the app, and recording a reading takes under a minute.
I forgot my password — what do I do?
Use "Forgot password?" on the sign-in screen and we'll email you a reset code.
Can I delete my account?
Yes, at any time, directly in the app: Settings → Delete account. Your account and personal data are removed immediately.
I have existing records in spreadsheets — can I import them?
Yes. MyWell has template-based bulk upload for stations and measurements, so existing histories can move in without retyping.
Something else? Email marvi.groundwater@gmail.com — we're happy to help.
Start making your water visible
Join farmers, schools, researchers and agencies already monitoring their local water with MyWell.
Create a free account Sign in